Hello everyone, JavaRush community. Today we’ll talk about debugging: what it is and how to debug in Intellij IDEA. The article is intended for people who already have minimal knowledge of Java Core. There will be no frameworks or complex processes for publishing libraries. Easy walk. So make yourself comfortable and let's get started!
Why do you need Debug?
Let's make it clear right away: there is no code without bugs... This is how life works. Therefore, we should not immediately become limp and give up everything if the code does not work as we expected. But what to do? Of course, you can set it System.out.printlnwherever you can and then sort through the output in the terminal in the hope that you will be able to find an error. Still, it’s possible... and they do it, and they do it carefully using logging (you can read about it here ). But if it is possible to run the code on the local machine, it is better to use Debug . I would like to note right away that in this article we will consider debugging a project inside Intellij IDEA. If you are interested in reading about remote debugging, here is an article from our resource .
What is Debug
Debug is the process of debugging (checking) code, when during its execution you can stop at a designated place and watch the progress of execution. Understand the state of the program in a certain place. It’s exactly the same as if you could stop life and look at everything from the outside. Cool, right? Our goal is to quickly and easily learn how to debug applications using our favorite development environment, Intellij IDEA.
What you need to start debugging
I give free advice: while you are reading the article, do everything that will be described here, fortunately there is everything for this. What do you need:
Intellij IDEA development environment version 2019.3.1 and higher. In case someone doesn't have it, here is a link where you can download it. Download the Community Edition because that's what I'll be using.
Open IDEA: Select the debug-presentation project , click OK and get: Leave import project from external sources, Maven and click Finish . Having imported the project, we can describe the process using a live example.
A little theory... I promise :D
To start debugging a little bit, you need to understand what breakPoint is and understand a few hotkeys that you need to get started. BreakPoint is a special marker that displays the location or state at which the application should be stopped. You can set a breakpoint either by left-clicking on the left sidebar, or by clicking on the code location and pressing Ctrl + F8 . Breakpoints come in three types: line mark, variable mark, and method mark. It looks like this:
Per line:
if there is a lambda in the expression, then IDEA offers you a choice - to put the expression on the entire line or specifically in the lambda:
Per method:
Per class
Breakpoints can be removed by following the same steps as when adding them. There are situations when you need to make them inactive (mute). To do this, in the Debug section, you can find an icon that will make all breakpoints inactive. To see which breakpoints have already been set, you can either go to Debug in the lower left corner and find the icon , or press Ctrl+Shift+F8 : When we go to the list of breakpoints, we will see: There are two preakpoints here:
Bee.java:24 - in the Bee class on line 24
Main.java:14 - in the Main class on line 14
I would like to note that when you clone a project, you will not have these BreakPoints: you need to set them yourself! There is also a Java Exception Breakpoints section . A very useful thing. Using it, you can add an implicit breakpoint so that the program stops before throwing any exception or a specific one. Let's add an implicit breakpoint for RuntimeException. This is done easily: in the upper left corner there is a plus sign “+”. Click on it and select Java Exceptions Breakpoints : In the window that appears, write the name of the exception that needs to be added, select from the proposed list and click OK : We finish this educational program and move on to practice.
Let's go, let's break into the wilds of the debug
Since I am a hereditary beekeeper, for the debugging presentation I created a project that describes the process of collecting nectar by bees, processing nectar into honey and obtaining honey from the hive. Based on the documentation of the README file, which lies in the root of the project, we read: expected behavior - from all flowers from which nectar is collected (as a double value), an amount of honey will be collected equal to half of the collected nectar. The project has the following classes:
Bee - an ordinary worker bee;
BeeQueen - queen bee;
BeeHive - beehive;
HoneyPlant - honey plant from which honey is collected;
Main - where public static void main()the method in which the project starts is located.
If you run the method main(), it turns out that not only is the amount of honey not counted, but an error also appears... You need to look at what is wrong there. From the stack trace in the lower right corner, we can see that in HoneyPlant.java:20, a RuntimeException is thrown: This is exactly our case: there is a RuntimeException, let’s add a search for such an exception, as described above, and run main()the method in debug mode. To do this, click on the green triangle arrow in Intellij IDEA before the method main(): and we will get the stopped program at the moment before the exception with this icon is triggered . To get complete information, you need to look in the Debug section. It has Variables , which shows all the variables available in this part of the application:
nectar = 1.0;
nectarCapacity = -1.0.
The exception is thrown fairly, since the value of the amount of nectar that is in the honey plant cannot be negative. But why does this happen? After all, there is a check that if the nectar runs out, then a zero value is returned in lines 15-17:
if( nectar ==0){return0;}
But the catch is that it is checking the wrong variable... and this is a bug in the code. Instead of checking the value of nectar in the flower, which is in the nectarCapacity variable , the program checks the value of nectar , which comes into the method and is the amount that they want to take from the nectar. Here it is, the first bug! Therefore, we put it correctly and get the expression:
if( nectarCapacity ==0){return0;}
Next, we run main()the method in normal mode (Run `Main.main()`)and there is no more error, the program worked: The application worked and gave the answer: “33.0 honey was produced by 7 bees from 2 honey plants” Everything would be fine, but the answer is wrong... All because in the documentation README file It is written that nectar turns into honey in a ratio of 2 to 1:
## DocumentationPresentation based on honey getting process.**Note**:1 honey point =2 nectar points
From the main method it can be seen that there are two honey plants, 30 and 40 units of nectar respectively, so in the end you should get 35 units of honey. And he writes that 33. Where did the other two units go?... Now we’ll find out! To do this, we need to put a breakpoint in the method Main.main()on line No. 28, where it is executed beeHive.populateHoney()and run mainthe method in Debug mode: Let’s take a closer look at this point. The program stopped before executing the 28th line. At the bottom we see the Debug section, which describes all the information on the running application. The Variables part, as already mentioned, contains all the variables and objects that are accessible from this part of the application. The Frames part shows the steps that the application goes through, you can look at the previous step and get all the local data. For the program to continue working, you can press F9 or the green icon, as shown below: To stop the program, you need to click on the red square: To restart the application in debug mode, you need to click on the arrow: Next, to go step by step through the application, you can use two keys:
F8 - go through a section of code and do not go into internal methods;
F7 - go through a section of code and enter internal methods.
Therefore, to enter the method into operation beeHive.populateHoney(), we need to press F7, and we will move on: Next, we go through debug mode using F8 using this method to the end and describe what happens in this method:
Line 25 - Stream API is used to collect honey from all bees;
26th line - honey is added to the existing one;
27th line - 2 units of honey are allocated for the queen;
28th line - these two units are removed from the total amount of honey;
Line 29 - the uterus eats this honey.
That's where these two units went, hurray! After communicating with a business analyst, we come to the conclusion that the documentation README file contains an error and will need to be updated. Let's update the README file:
## DocumentationPresentation based on honey getting process.**Note**:*1 honey point =2 nectar points
*2 honey point queen bee eats every time when beehive populates the honey.
And that’s it: all the bugs found have been fixed, we can calmly continue drinking coffee and reading articles on the JavaRush hub with a smart look :)
Summarize
In this article we figured out that:
there is no work without errors and debugging is a great way to solve them;
what is a breakpoint and what types does it exist;
 Debug is the process of debugging (checking) code, when during its execution you can stop at a designated place and watch the progress of execution. Understand the state of the program in a certain place. It’s exactly the same as if you could stop life and look at everything from the outside. Cool, right? Our goal is to quickly and easily learn how to debug applications using our favorite development environment, Intellij IDEA.

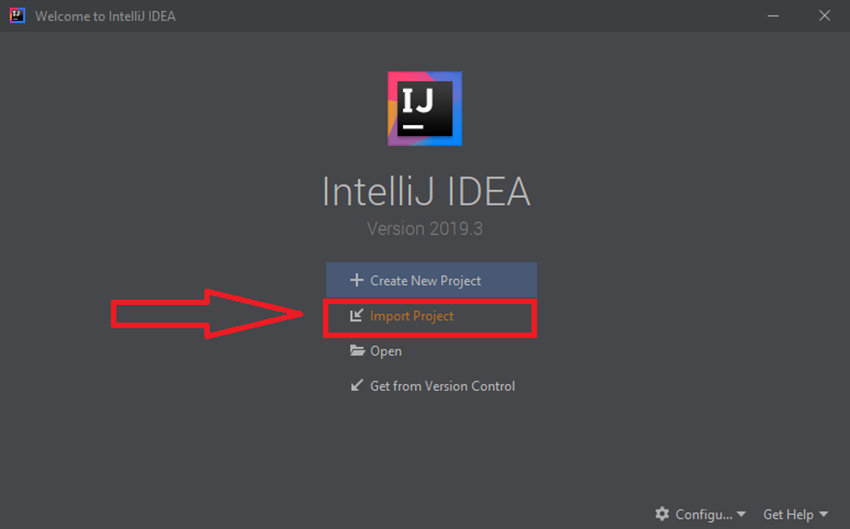 Select the debug-presentation project , click OK and get:
  Leave import project from external sources, Maven and click Finish . Having imported the project, we can describe the process using a live example.


 that will make all breakpoints inactive. To see which breakpoints have already been set, you can either go to Debug in the lower left corner and find the icon
  , or press Ctrl+Shift+F8 :
  When we go to the list of breakpoints, we will see:
  There are two preakpoints here:
 In the window that appears, write the name of the exception that needs to be added, select from the proposed list and click OK :
  We finish this educational program and move on to practice.
 Since I am a hereditary beekeeper, for the debugging presentation I created a project that describes the process of collecting nectar by bees, processing nectar into honey and obtaining honey from the hive. Based on
  You need to look at what is wrong there. From the stack trace in the lower right corner, we can see that in
  This is exactly our case: there is a RuntimeException, let’s add a search for such an exception, as described above, and run
  and we will get the stopped program at the moment before the exception with this icon is triggered
 . To get complete information, you need to look in the Debug section. It has Variables , which shows all the variables available in this part of the application:
 The application worked and gave the answer: “33.0 honey was produced by 7 bees from 2 honey plants” Everything would be fine, but the answer is wrong... All because in
  Let’s take a closer look at this point. The program stopped before executing the 28th line. At the bottom we see the Debug section, which describes all the information on the running application. The Variables part, as already mentioned, contains all the variables and objects that are accessible from this part of the application. The Frames part shows the steps that the application goes through, you can look at the previous step and get all the local data. For the program to continue working, you can press F9 or the green icon, as shown below:
  To stop the program, you need to click on the red square:
  To restart the application in debug mode, you need to click on the arrow:
  Next, to go step by step through the application, you can use two keys:
 Next, we go through debug mode using F8 using this method to the end and describe what happens in this method:
GO TO FULL VERSION